Marketing Campaign - helping to highlight account engagement
The Marketing Demand Generation Manager in Account Based Management World requires a Campaign Page to visualize the impact of campaigns on the CRM and advertising data, helping to highlight account engagement and return on ad spend (ROAS).
Tool:
Figma, Chorus
Type:
UX Research, Product Design
Info architecture & useful metrics
Explored competitors' data, filters, and data slices for analysis. Gathered all relevant metrics available. Conducted a dozen interviews with GTM to get their insights on which metrics they found important.
IXD&UI
Investigated useful visuals for this kind of data, color sets adopted by complex systems, and easy navigation. Analyzed how effective visual elements can improve user comprehension and engagement. Implemented these findings to create a more intuitive and visually appealing interface for our users.
Functionality & UX
Investigated features used by competitors to understand their functionality and user experience. Analyzed how these features enhance user engagement and satisfaction. Identified areas for improvement and opportunities to innovate within our own product.
Processual and Visual
How do they handle data visibility?
What metrics and CTAs do they use?
What's the key data on their DB?
How looks audience movement?
What info do they highlight?
Which filters are shown?
How do they present flow details?
About
Visualize the impact of campaigns on the CRM and advertising data, helping to highlight account engagement and ROAS.
The Marketing Demand Generation Manager in Account Based Management World requires a Campaign page to visualize the impact of campaigns on the CRM and advertising data, helping to highlight account engagement and return on ad spend (ROAS).
With this page, users should be able to:
see the entire lifecycle for accounts at different stages of their engagement journey.
gain campaign-level attribution and ROI insights to better understand the value of an advertising strategy.
easily determine his influence on his pipeline and quickly iterate campaigns and targeting.
Problem Definition
ABM demand generator campaign page creation involves identifying the challenges and requirements specific to creating a page for ABM demand generation campaigns.
Clients implementing ABM demand generation campaigns lack a comprehensive and centralized page solution to track, analyze, and optimize their campaign performance effectively.
Requirements
Data Integration: the page should seamlessly integrate CRM systems to aggregate and synchronize data in real time.
Account-Level Insights: the page should provide account-level metrics, such as engagement scores, account progression, contact interactions, and key account activities, to evaluate campaign performance and identify opportunities for personalized engagement.
ROI Measurement: the page should calculate and present key ROI metrics, including revenue generated, cost per lead/account, customer acquisition costs, and ROI percentage, to assess campaign effectiveness and demonstrate the value of ABM initiatives.
Visualization: the page should provide visually appealing, interactive charts and graphs to enable quick monitoring, analysis, and decision-making.
Perception of solution
The perception of the solution for ABM (Account-Based Marketing) for campaign page creation can vary depending on the perspective of the stakeholders involved. It could be Marketing Professionals, Sales teams, Executives and Decision-makers, Data Analysts, or IT Professionals.
In my case, it is:
DG: marketing professionals who are implementing ABM strategies would likely perceive an ABM campaign page creation solution as highly valuable. They would see it as a tool that provides them with a centralized view of their target accounts, allowing them to track and measure the effectiveness of their ABM campaigns.
The solution would ideally provide insights into:
engagement metrics
account-level performance
progress within target accounts
Marketing professionals require features that enable them to personalize content, monitor account activity, and align marketing efforts with sales goals.
DG Managers: executives and decision-makers within an organization would perceive an ABM campaign page creation solution as valuable for evaluating the overall effectiveness of ABM initiatives.
They would appreciate the ability to assess the impact of ABM campaigns on key business metrics, such as:
revenue
customer acquisition
customer retention
The solution should provide them with insights into account-level performance, ROI, and the alignment between marketing and sales efforts.
As a user, I am an ABM DG Manager, and I want to see the performance of my campaigns so that I can find the best strategies of account engagement through Marketing Funnel.
Solution
Campaign page helps to visualize the impact of campaigns on user's CRM and advertising data, helping to highlight account engagement and return on ad spend (ROAS). With the Campaign page, users can:
see the entire lifecycle for accounts at different stages of their engagement journey
gain campaign-level attribution and ROI insights to better understand the value of your advertising strategy
easily determine influence on the pipeline and quickly iterate campaigns and targeting.
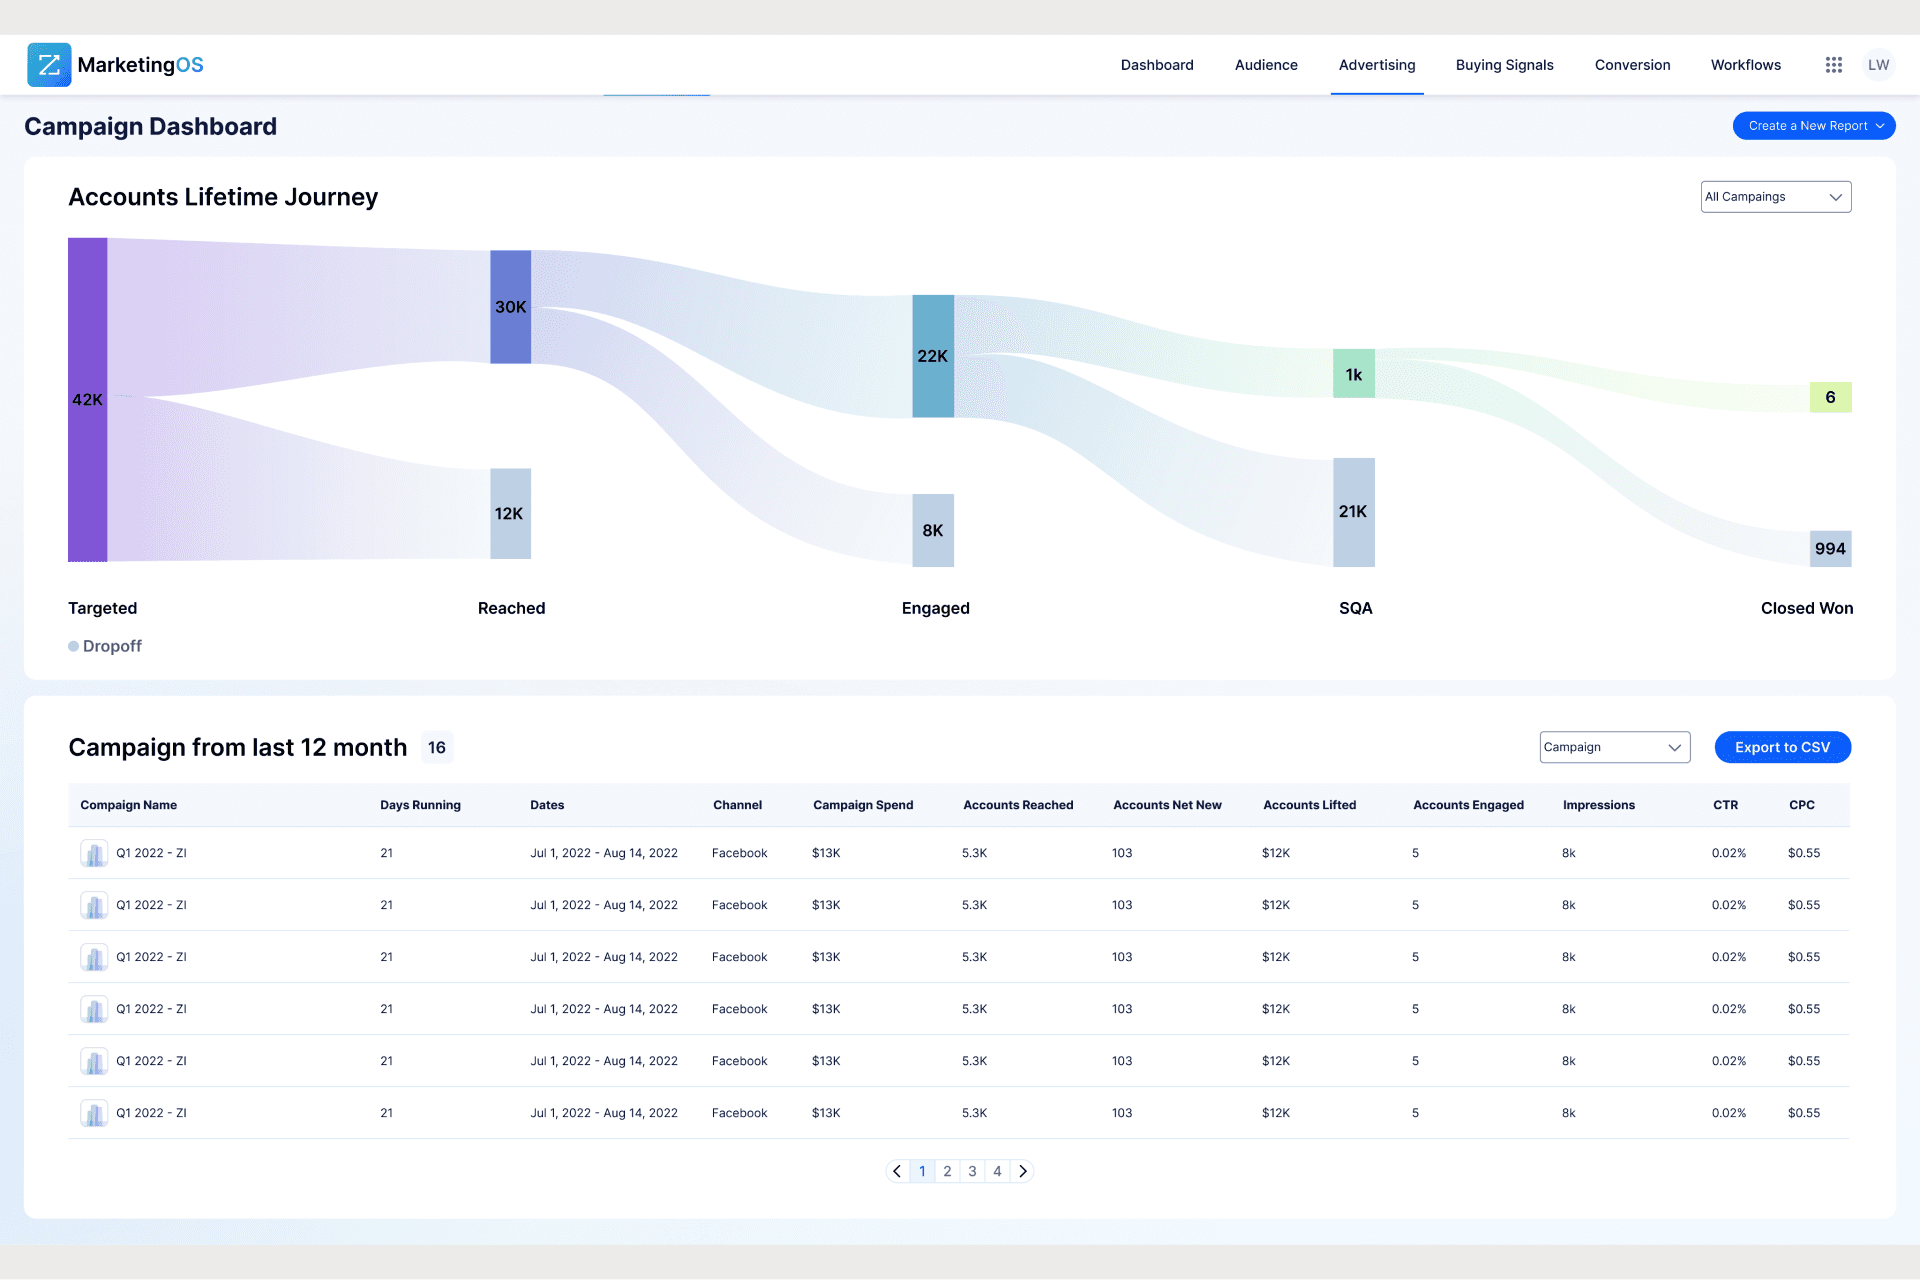
The Accounts Lifetime Journey diagram shows the following phases:
Targeted: accounts in audiences that have been targeted during a campaign
Reached: an account that has received one impression
Engaged: an account that has received one impression and two unique page views within 24 hours of the impression
Sales qualified account: an account that had an opportunity created while the campaign was live up to 90 days after it ended
Closed won: an account that had a closed won opportunity while a campaign was live up to 90 days after it ended
At the bottom of the page, the Campaigns from the past 12 months section provides another view of campaigns for the past 12 months.
In this section, user can:
view metrics per campaign and switch to a monthly view to see a month-by-month breakdown.
export the data from this table to a CSV file.
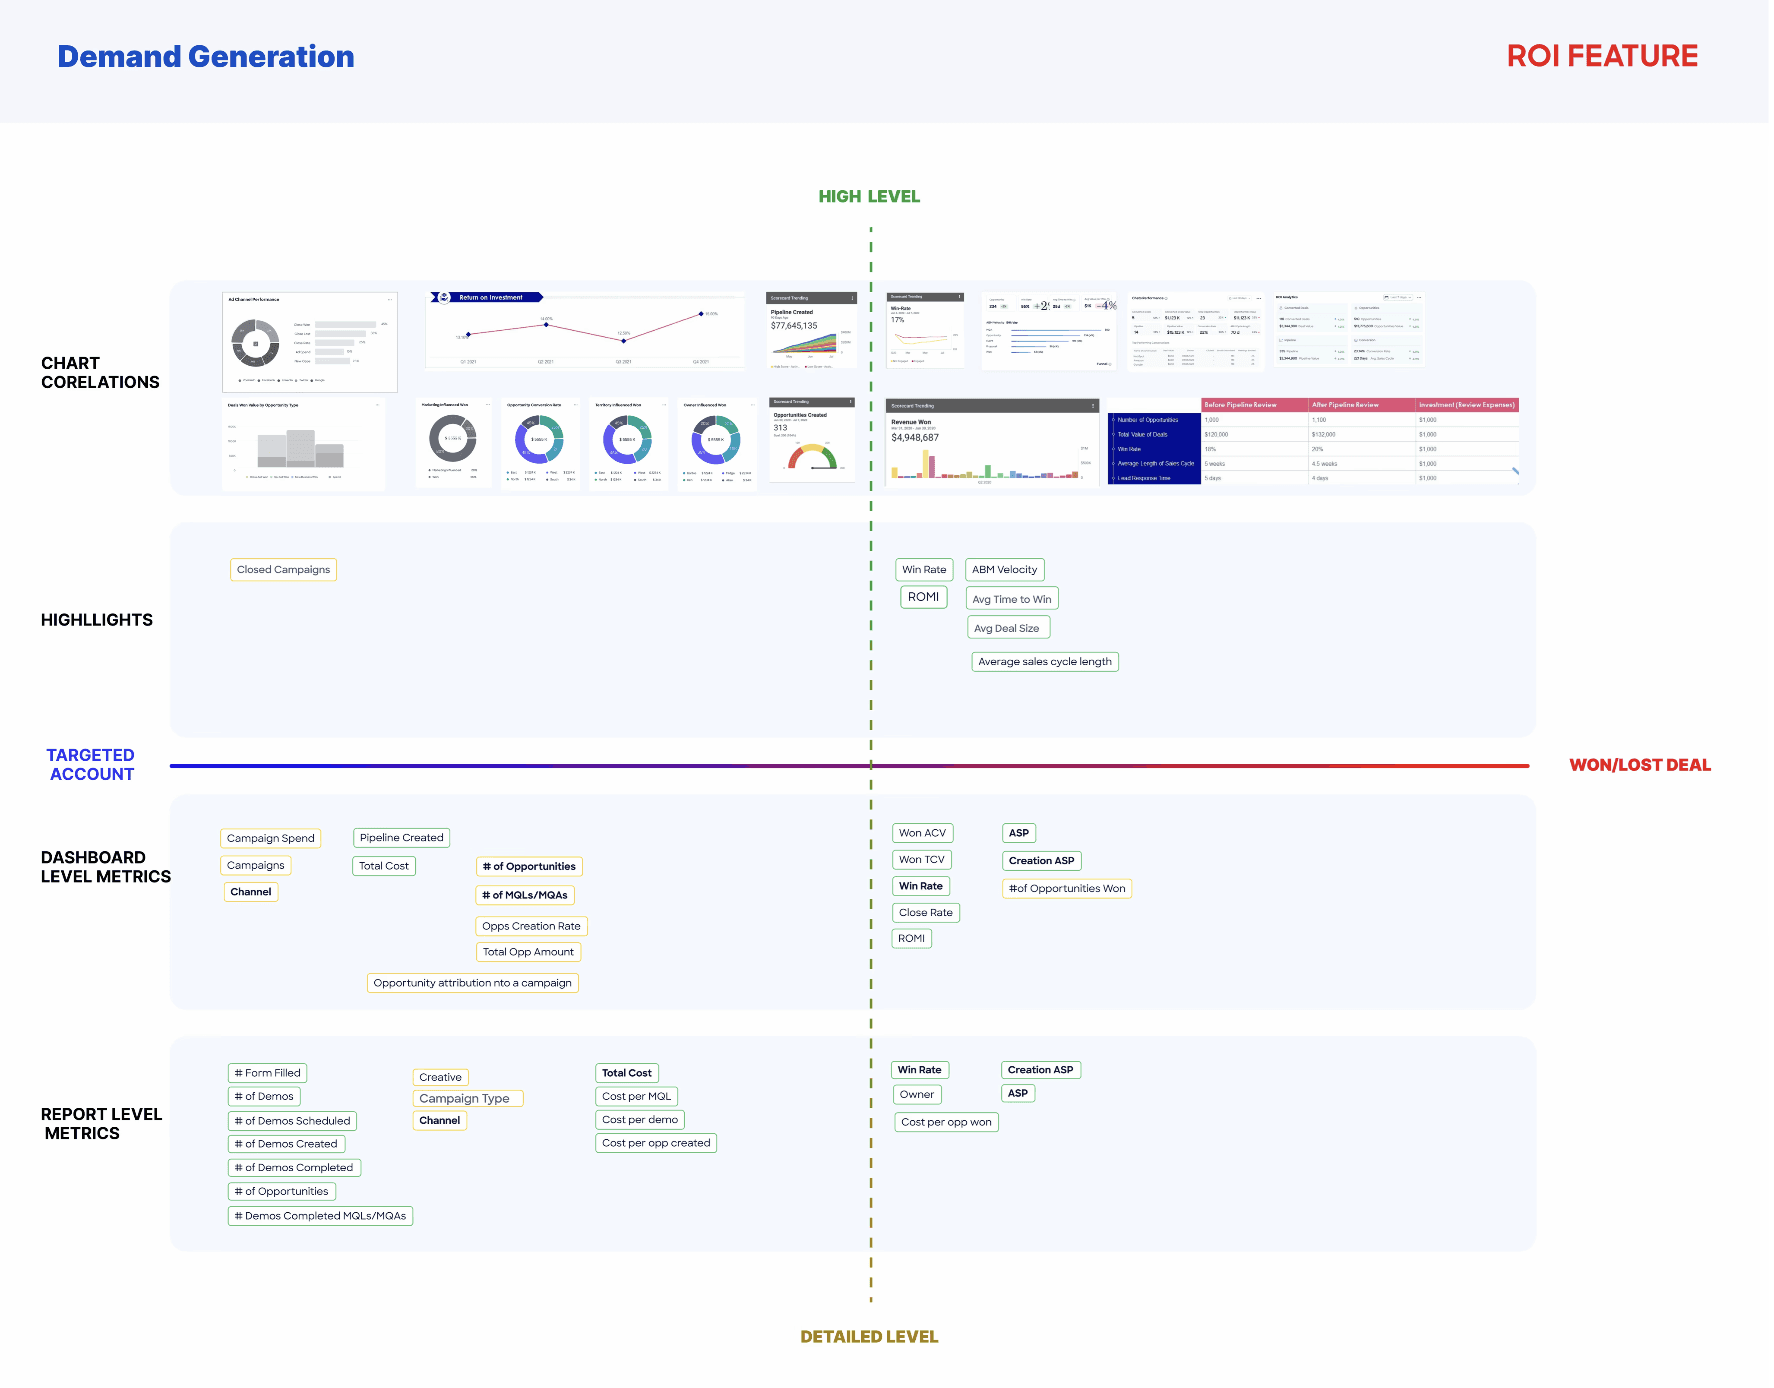
Metrics analysis
The metrics are categorized into two dimensions:
Importance on the sales pipeline (from targeted accounts to won/lost deals).
Significance of the metrics on the page (including highlights, dashboard-level metrics, report-level metrics, and chart-level metrics).


