DORA Metrics - where numbers lead to innovation and excellence
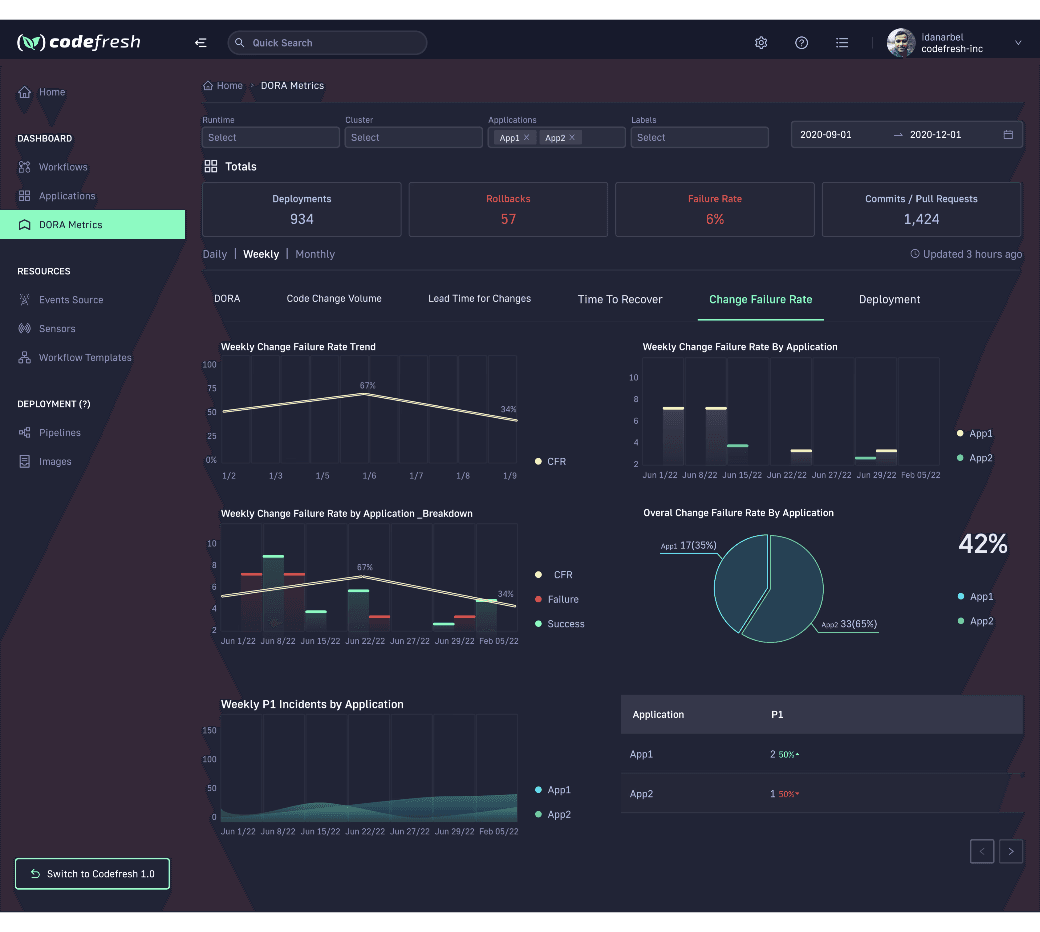
Welcome to the DORA Dashboard Project, where data meets transformation. In this project, we journey through the realms of DevOps research and assessment, armed with the potent DORA metrics. Our mission is simple: to reveal the untapped potential of DORA dashboards and how they can revolutionize your software delivery processes. With these dashboards, users transform raw data into actionable insights, driving organizations towards a future of data-driven, efficient, and high-performing DevOps practices.
Tool:
Figma
Type:
DX/UI Design
46
TIMES MORE
FREQUENT CODE DEPLOYMENT
7
TIMES LOWER
CHANGE FAILURE RATE
2.5К
TIMES FASTER
LEAD TIME TO DEPLOY
2.6К
TIMES FASTER
TIME TO RECOVER FROM INCIDENTS
About
Utilization Dora Research acquired by Google in 2018 as the foundation for this design work. Apart from incorporating DORA Metrics, supplementary dashboards were created to cover the entire development process.
The Accelerate State of DevOps Report is the largest and longest running research of its kind. It represents five years of work surveying over 30,000 technical professionals worldwide (State of DevOps).
Solution
Measuring Progress, Maximizing Performance with DORA Metrics
The DevOps Research and Assessment (DORA) group published its State of DevOps report with insights from six years of research. It identified four key metrics for measuring DevOps performance, known as the DORA metrics:
deployment Frequency - how often an organization successfully releases
lead Time for Changes: the length of time for a commit to be deployed
change Failure Rate - the percentage of deployments causing a failure
time to Restore Service - the length of time for an organization to recover from a failure
DevOps is a collaboration paradigm that is sometimes mistaken for being too abstract or too generic. In an effort to quantify the benefits of adopting DevOps, Dora Research, has introduced four key metrics that define specific goals for improving the software lifecycle in companies interested in adopting DevOps.
According to DORA’s research, high performing DevOps teams are those who optimize for these metrics. Organizations can use the metrics to measure performance of software development teams and improve the effectiveness of DevOps operations.
In addition to the current set of DORA metrics, I analyzed a substantial quantity of sub-metrics that can be instrumental in identifying bottlenecks and areas of low performance within the pipeline. A deep dive is presented inside slides.
The project has been covered in the media


